


February New Car Registrations up 9.9%, with EV sales up 37.5% – SIMI
February new car registrations up 9.9%.
The Society of the Irish Motor Industry (SIMI) today (March 1st) released their official 231 new vehicle registrations statistics for February.
New car registrations for the month of February were up 9.9% (13,161) when compared to February 2022 (11,971). Registrations year to date are up 9.4% (40,476) on the same period last year (36,985).
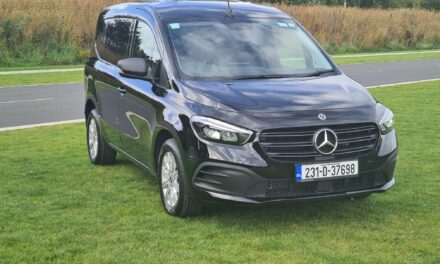
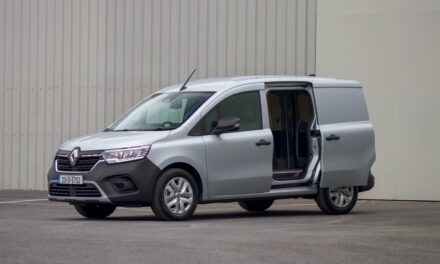
Light Commercial vehicles (LCV) are up 12.8% (2,585) compared to February last year (2,291) and year to date are up 11.0% (8,152). HGV (Heavy Goods Vehicle) registrations are also showing an increase of 45.9% (267) in comparison to February 2022 (183). Year to date HGV’s are up 49.9% (691).
Imported Used Cars seen a 4.9% (3,990) increase in February 2023, when compared to February 2022 (3,805). Year to date imports are marginally down 0.9% (7,776) on 2022 (7,846).
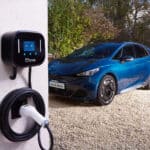
For the month of February 2,219 new electric vehicles were registered compared to 1,614 in February 2022 (+37.5%). So far this year 5,893 new electric cars have been registered in comparison to 4,311 on the same period 2022.
Electric Vehicle and Plug-in Hybrids and Hybrids continue to increase their market share, with a combined market share now of 41%. Internal combustion engine type vehicles remain dominant with petrol accounting for 32.48%, Diesel 23.32%, Hybrid 19.16%, Electric 14.56% and Plug-in Electric Hybrid 7.59%.
Brian Cooke, SIMI Director General commenting:
“February new car registrations have continued on a similar pattern to January, with a 9.9% increase compared to the same month last year, but still lagging 13% behind pre-Covid February 2019. Sales of commercial vehicles both Light (LCV) and Heavy (HGVs), have shown a strong increase on last year. Electric Vehicles (EVs) continue to outperform the market. Increased supply, strong Government supports and the State’s commitment to investing in charging infrastructure, are all essential elements in encouraging the transition to electric. Drilling into the EV sales patterns, it is important to highlight private customers, who still benefit from the SEAI Grant, account for 75% of EV sales so far this year, with these sales increasing by over 40% when compared to last year. On the other hand, sales of new EVs to companies, which don’t benefit from the grant support, and which now attract a higher level of BIK since January, are slightly down on last year. This underlines the importance of the grant and it is vital that we that we don’t interrupt consumer momentum by continuing this support at current levels beyond June”.
2023 Total New Vehicle Stats.
- New Car sales total year to date (2023) 40,476 v (2022) 36,985 +9.4%
- New Car sales total year to date (2023) 40,476 v (2019) 47,439 -14.7%
- New Car sales total February (2023) 13,161 v (2022) 11,971 +9.9%
- New Car sales total February (2023) 13,161 v (2019) 15,069 -12.7%
- Light Commercial Vehicles sales year to date (2023) 8,152 v (2022) 7,342 +11.0%
- Light Commercial Vehicles sales year to date (2023) 8,152 v (2019) 8,013 +1.7%
- Light Commercial Vehicles sales total February (2023) 2,585 v (2022) 2,291 +12.8%
- Light Commercial Vehicles sales total February (2023) 2,585 v (2019) 2,465 +4.9%
- Heavy Goods Vehicle total sales year to date (2023) 691 v (2022) 461 +49.9%
- Heavy Goods Vehicle total sales year to date (2023) 691 v (2019) 535 +29.2%
- Heavy Goods Vehicle total sales February (2023) 267 v (2022) 183 +45.9%
- Heavy Goods Vehicle total sales February (2023) 267 v (2019) 241+10.8%
- New Busses/ Coaches sales year to date (2023) 89 v (2022) 112 -20.5%
- New Busses/ Coaches total sales February (2023) 52 v (2022) 58 -10.3%
- Used Car Imports total year to date (2023) 7,776 v (2022) 7,846 -0.9%
- Used Car Imports total year to date (2023) 7,776 v (2019) 17,862 -56.5%
- Used Car Imports total February (2023) 3,990 v (2022) 3,805 +4.9%
- Used Car Imports total February (2023) 3,990 v (2019) 8,859 -55.0%
- New Electric Vehicles sales total year to date (2023) 5,893 v (2022) 4,311 +36.7%
- New Electric Vehicles sales total year to date (2023) 5,893 v (2019) 1,124 +424.3%
- New Electric Vehicles sales February (2023) 2,219 v (2022) 1,614 +37.5%
- New Electric Vehicles sales February (2023) 2,219 v (2019) 325 +582.8%
- 5 Top Selling Car Brands 2023 were: 1. TOYOTA, 2. HYUNDAI, 3. VOLKSWAGEN, 4. SKODA, 5. KIA
- 5 Top car model’s year 2023 were: 1. HYUNDAI TUCSON, 2. TOYOTA YARIS CROSS, 3. KIA SPORTAGE, 4. TOYOTA C-HR, 5. TOYOTA YARIS
- 5 Top Selling Electric Vehicles (EVs) Car Brands 2023: 1. HYUNDAI, 2. VOLKSWAGEN, 3. KIA, 4. BMW, 5. NISSAN
- 5 Top Selling Electric Vehicles (EVs) models 2023: 1. HYUNDAI IONIQ 5, 2. VOLKSWAGEN ID.4, 3. HYUNDAI KONA, 4. KIA EV6, 5. BMW I4
- Top Selling Car (February) 2023: KIA SPORTAGE
- Top Selling Electric Car (February) 2023: VOLKSWAGEN ID.4
- Market share by engine type 2023: Petrol 32.48%, Diesel 23.32%, Hybrid 19.16%, Electric 14.56%, Plug-In Hybrid 7.59%
- Tables below shows total new car registrations by county 2023 and total new electric car registrations by county 2023.
|
· New Car Registrations by County 2023 (January-February) |
|||||
|
County |
2023 Units |
2022 Units |
% Change |
2023 % Share |
2022 % |
|
Carlow |
469 |
470 |
-0.21 |
1.16 |
1.27 |
|
Cavan |
488 |
447 |
9.17 |
1.21 |
1.21 |
|
Clare |
896 |
816 |
9.8 |
2.21 |
2.21 |
|
Cork |
4993 |
4938 |
1.11 |
12.34 |
13.35 |
|
Donegal |
945 |
907 |
4.19 |
2.33 |
2.45 |
|
Dublin |
15669 |
12780 |
22.61 |
38.71 |
34.55 |
|
Galway |
1717 |
1753 |
-2.05 |
4.24 |
4.74 |
|
Kerry |
907 |
844 |
7.46 |
2.24 |
2.28 |
|
Kildare |
1784 |
1794 |
-0.56 |
4.41 |
4.85 |
|
Kilkenny |
756 |
770 |
-1.82 |
1.87 |
2.08 |
|
Laois |
502 |
498 |
0.8 |
1.24 |
1.35 |
|
Leitrim |
154 |
149 |
3.36 |
0.38 |
0.4 |
|
Limerick |
1458 |
1319 |
10.54 |
3.6 |
3.57 |
|
Longford |
194 |
222 |
-12.61 |
0.48 |
0.6 |
|
Louth |
970 |
957 |
1.36 |
2.4 |
2.59 |
|
Mayo |
728 |
721 |
0.97 |
1.8 |
1.95 |
|
Meath |
1434 |
1436 |
-0.14 |
3.54 |
3.88 |
|
Monaghan |
349 |
324 |
7.72 |
0.86 |
0.88 |
|
Offaly |
484 |
482 |
0.41 |
1.2 |
1.3 |
|
Roscommon |
410 |
375 |
9.33 |
1.01 |
1.01 |
|
Sligo |
397 |
408 |
-2.7 |
0.98 |
1.1 |
|
Tipperary |
1130 |
1106 |
2.17 |
2.79 |
2.99 |
|
Waterford |
991 |
948 |
4.54 |
2.45 |
2.56 |
|
Westmeath |
607 |
585 |
3.76 |
1.5 |
1.58 |
|
Wexford |
1079 |
987 |
9.32 |
2.67 |
2.67 |
|
Wicklow |
965 |
949 |
1.69 |
2.38 |
2.57 |
Click here to download pdf
|
New Electric Vehicle Registrations by County 2023 |
|||||
|
County |
2023 Units |
2022 Units |
% Change |
2023 % Share |
2022 % |
|
Carlow |
62 |
45 |
37.78 |
1.05 |
1.04 |
|
Cavan |
45 |
24 |
87.5 |
0.76 |
0.56 |
|
Clare |
107 |
48 |
122.92 |
1.82 |
1.11 |
|
Cork |
644 |
428 |
50.47 |
10.93 |
9.93 |
|
Donegal |
89 |
62 |
43.55 |
1.51 |
1.44 |
|
Dublin |
2564 |
1903 |
34.73 |
43.51 |
44.14 |
|
Galway |
235 |
179 |
31.28 |
3.99 |
4.15 |
|
Kerry |
98 |
82 |
19.51 |
1.66 |
1.9 |
|
Kildare |
319 |
269 |
18.59 |
5.41 |
6.24 |
|
Kilkenny |
79 |
72 |
9.72 |
1.34 |
1.67 |
|
Laois |
59 |
47 |
25.53 |
1 |
1.09 |
|
Leitrim |
18 |
8 |
125 |
0.31 |
0.19 |
|
Limerick |
172 |
110 |
56.36 |
2.92 |
2.55 |
|
Longford |
14 |
10 |
40 |
0.24 |
0.23 |
|
Louth |
127 |
79 |
60.76 |
2.16 |
1.83 |
|
Mayo |
80 |
66 |
21.21 |
1.36 |
1.53 |
|
Meath |
275 |
205 |
34.15 |
4.67 |
4.76 |
|
Monaghan |
21 |
18 |
16.67 |
0.36 |
0.42 |
|
Offaly |
51 |
35 |
45.71 |
0.87 |
0.81 |
|
Roscommon |
37 |
20 |
85 |
0.63 |
0.46 |
|
Sligo |
57 |
58 |
-1.72 |
0.97 |
1.35 |
|
Tipperary |
132 |
106 |
24.53 |
2.24 |
2.46 |
|
Waterford |
123 |
94 |
30.85 |
2.09 |
2.18 |
|
Westmeath |
85 |
63 |
34.92 |
1.44 |
1.46 |
|
Wexford |
160 |
109 |
46.79 |
2.72 |
2.53 |
|
Wicklow |
240 |
171 |
40.35 |
4.07 |
3.97 |
Click here to download pdf